hero · experimentation
Improving conversion through data-informed design
How I used behavioral data, A/B testing, and iterative design to improve checkout conversion, reduce abandonment, and increase cross-sell engagement at Civitatis.
specs
hero-visual
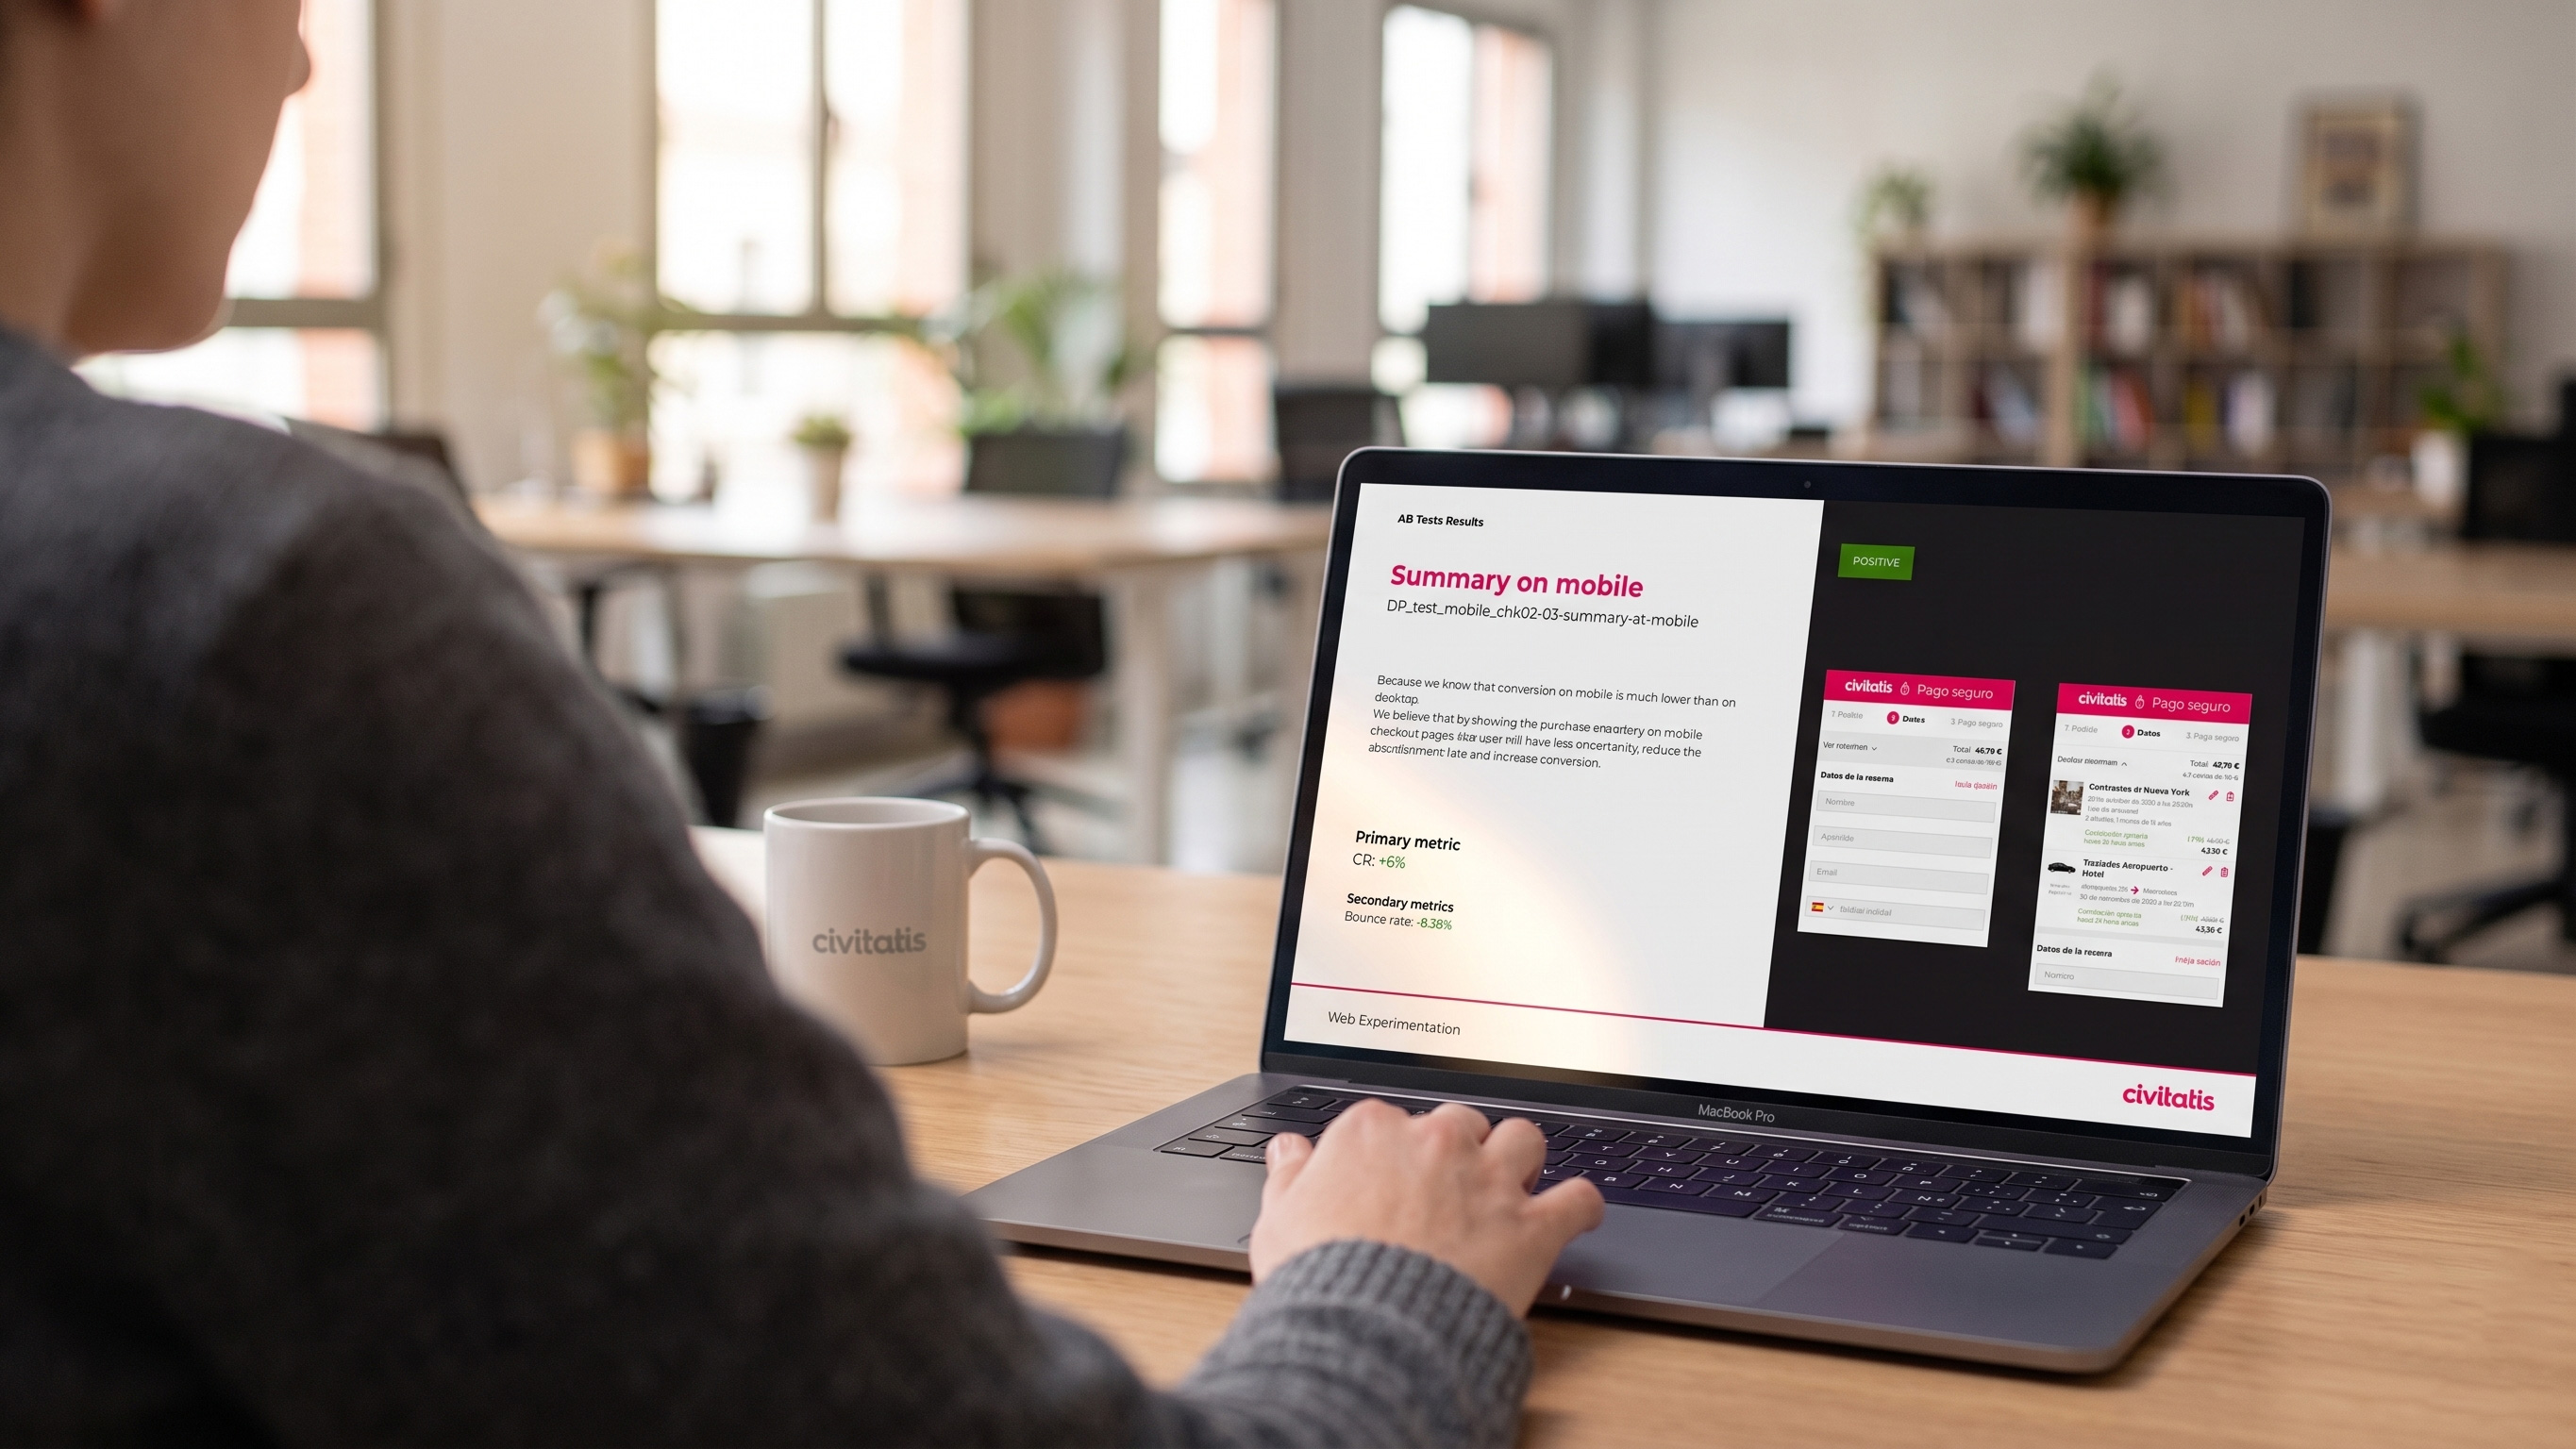
context
Civitatis operates a high-traffic travel platform with multiple lines of business (B2C, B2B, mobile) and a complex conversion funnel. Despite strong traffic, conversion opportunities were being missed, decisions were often driven by intuition rather than evidence, and significant changes shipped without validating their impact.
I used behavioral analytics and A/B testing to identify friction points in the funnel and design targeted improvements, validated by data before scaling.
my-role
As Principal Product Designer IC, my work focused on:
- Analyzing behavioral data (GA, ContentSquare) to identify conversion opportunities
- Designing and prototyping experimental variations
- Configuring and monitoring tests in ABTasty, Optimizely
- Collaborating with PMs and engineers on hypothesis framing
- Integrating data insights into product decisions
Design targeted solutions to real user problems, validated by data.
my-role
As Principal Product Designer IC, I analyzed behavioral data to identify conversion opportunities, designed and prototyped experimental variations, and configured tests in ABTasty and Optimizely. I worked closely with PMs and engineers to frame hypotheses and design targeted solutions to real user problems, validated by data.
experiments-intro
Five representative experiments from the booking funnel, each run to statistical significance.
experiment-pdp-above-the-fold
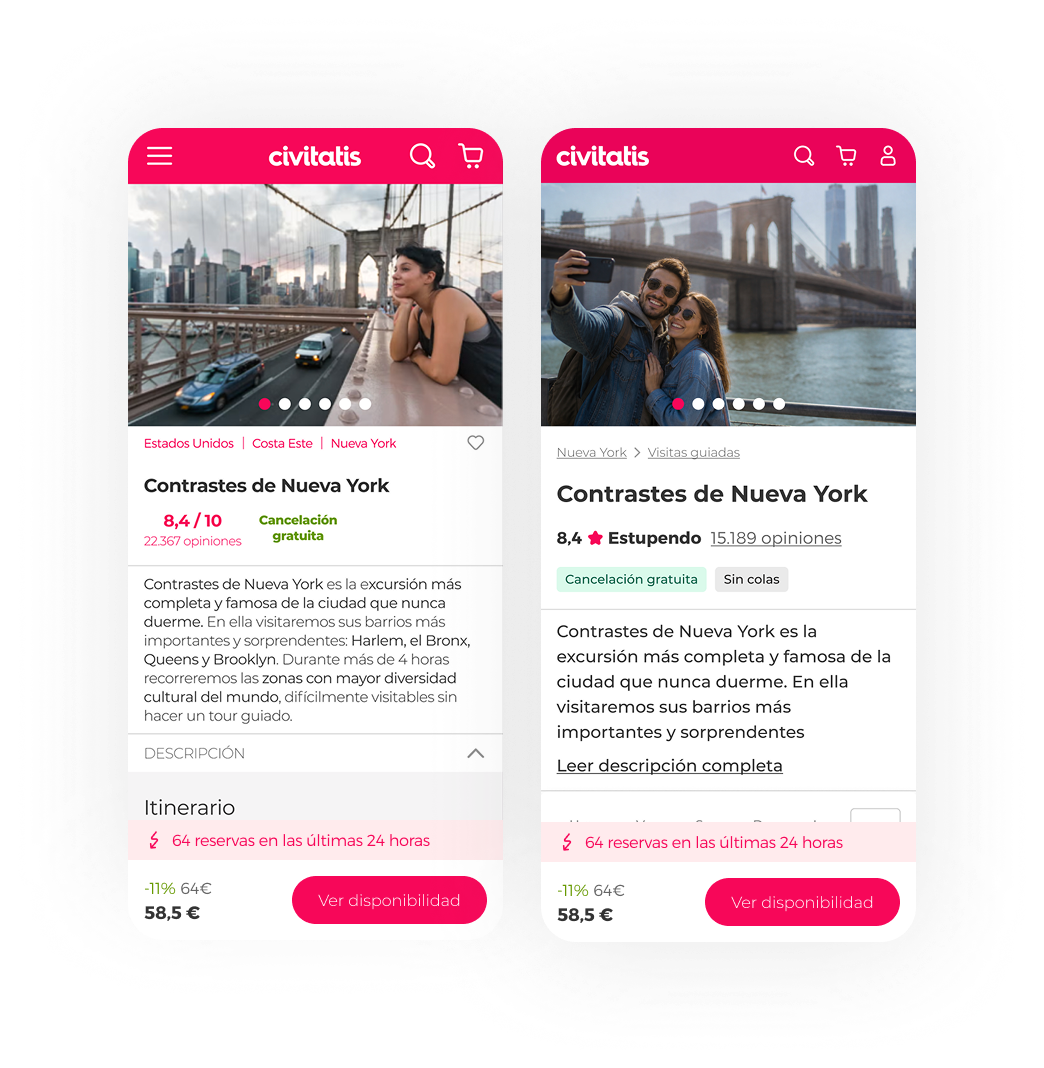
Redesigning the mobile PDP above-the-fold
Context
The product detail page on mobile is Civitatis' highest-traffic page but its worst converter. It inherits large volumes of organic and paid traffic, yet around 90% of sessions leave without interacting. Users land, scan the first screen, and bounce before scrolling or engaging with the content.
Hypothesis
Because we know the mobile PDP has a very high bounce rate from users who never interact with the page, we believe that redesigning the above-the-fold area to reduce cognitive load and surface the activity's rating as a trust anchor will lower bounce and lift add-to-cart and conversion rate.
"As a user, the first screen should tell me what this is, that other travelers loved it, and why I should keep reading — in one glance."
Key learnings
- Social proof needs hierarchy to work: the rating was already on the page as "8.4 / 10", but promoting it to a star icon with a semantic label ("Estupendo · 15,189 opiniones") turned a passive number into a decision trigger users could read without parsing
- On mobile, above-the-fold is the whole product page: most users decide to engage or bounce before the first scroll, which is why a change scoped to a single screen moved every funnel step simultaneously (add to cart, begin checkout and purchase)
- Less information above the fold does not mean worse decisions: collapsing the long description behind "Leer descripción completa" shortened the first screen while raising engagement. Users who want depth will tap, and the ones who need confidence first were not getting it before
experiment-side-cart
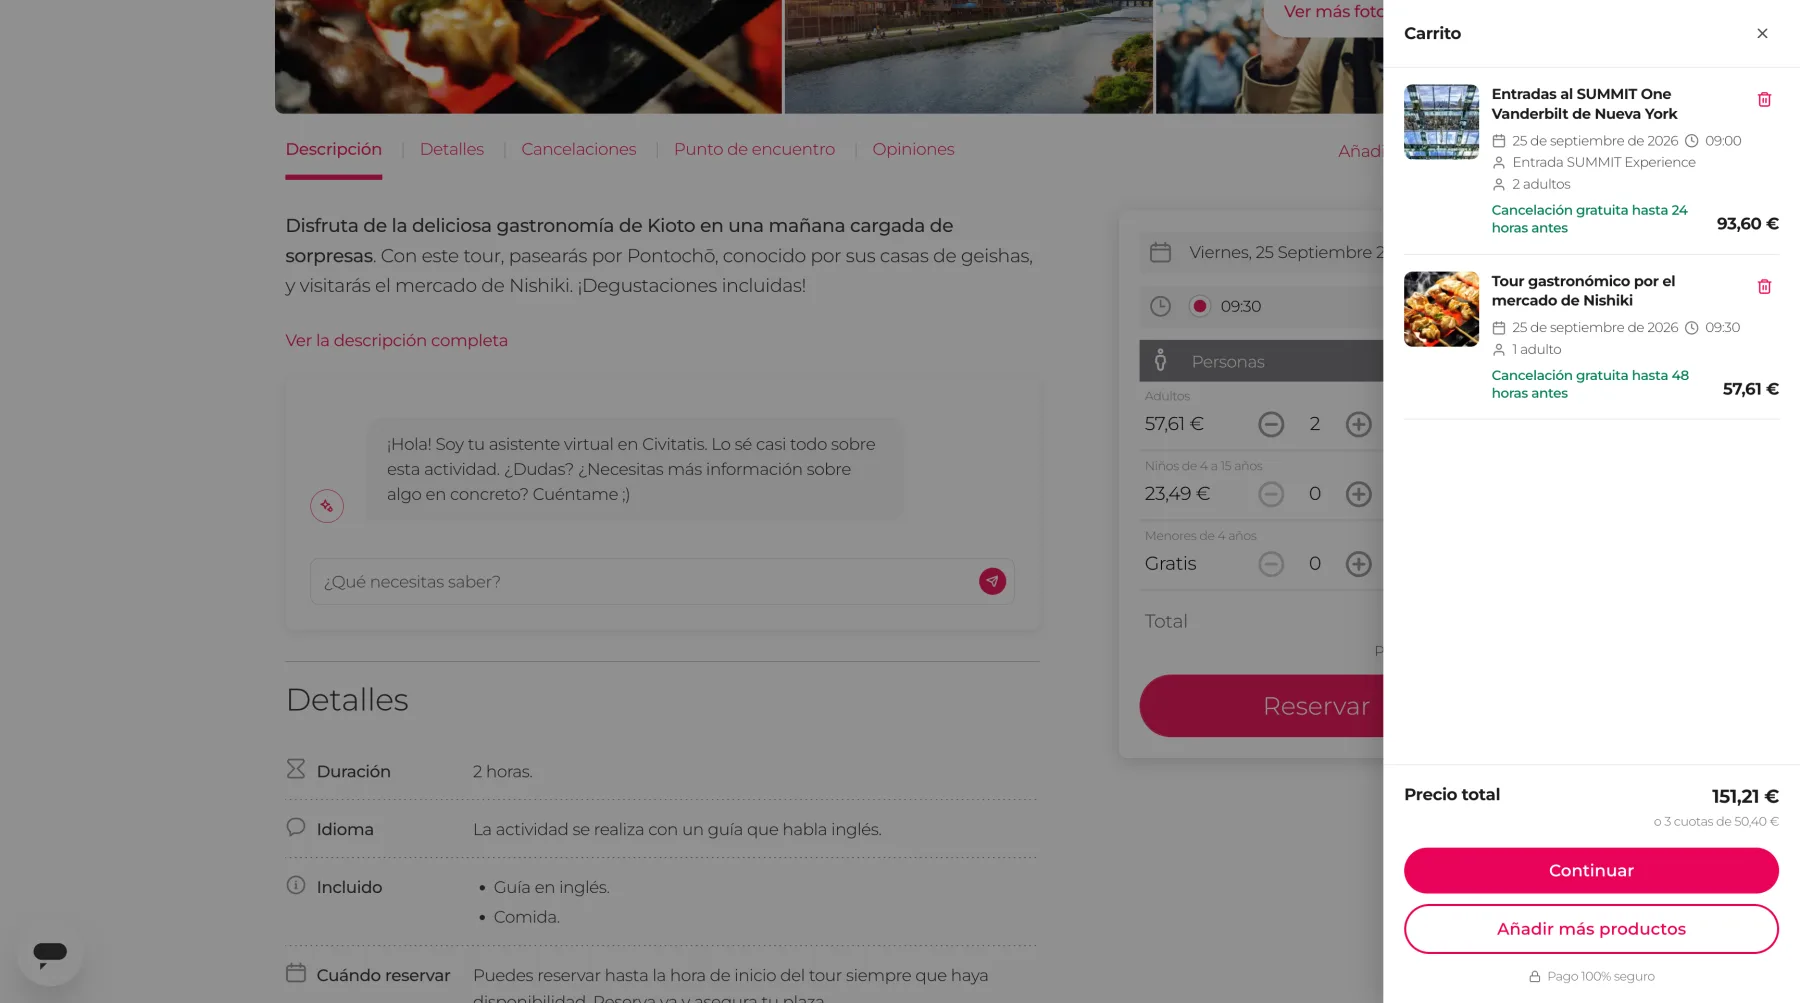
Floating cart on the PDP
Context
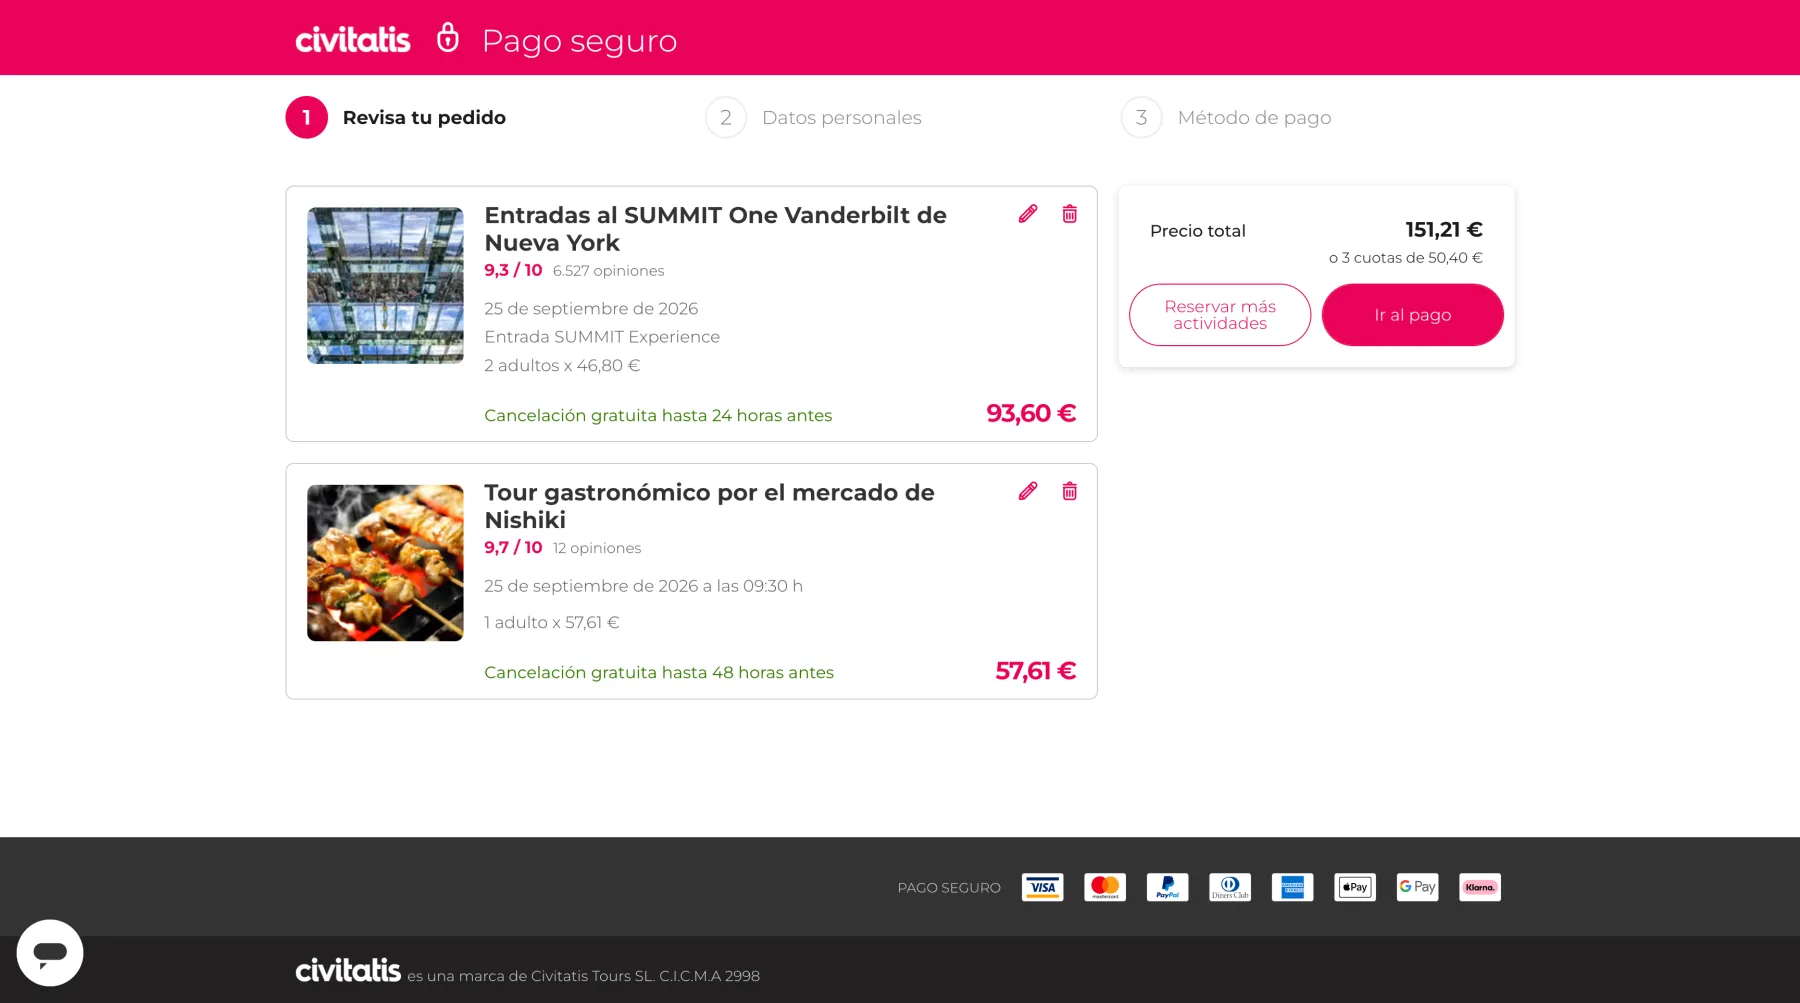
Clicking Reservar on the product detail page sent users to a dedicated three-step checkout, starting with "Revisa tu pedido". That first step pulled users out of the activity they were engaging with, into a new page, just to confirm what was already in their cart — a context switch at a very fragile moment.
Hypothesis
Because we know that step 1 of the current checkout can create friction by interrupting the user's flow and taking them away from the PDP, we believe that replacing it with a floating cart that opens from the right — keeping the PDP visible underneath — could lift conversion without raising abandonment.
"As a user, I don't want to leave the page I'm reading just to check what's in my cart."
Key learnings
- Context preservation beats step reduction: the floating cart is still "step 1", but reframing it as an overlay keeps users anchored to the PDP instead of forcing a page transition
- Keeping the product visible invites richer baskets, not just more conversions, the lift showed up on AOV and ARPU as well as on purchases
experiment-mobile-checkout
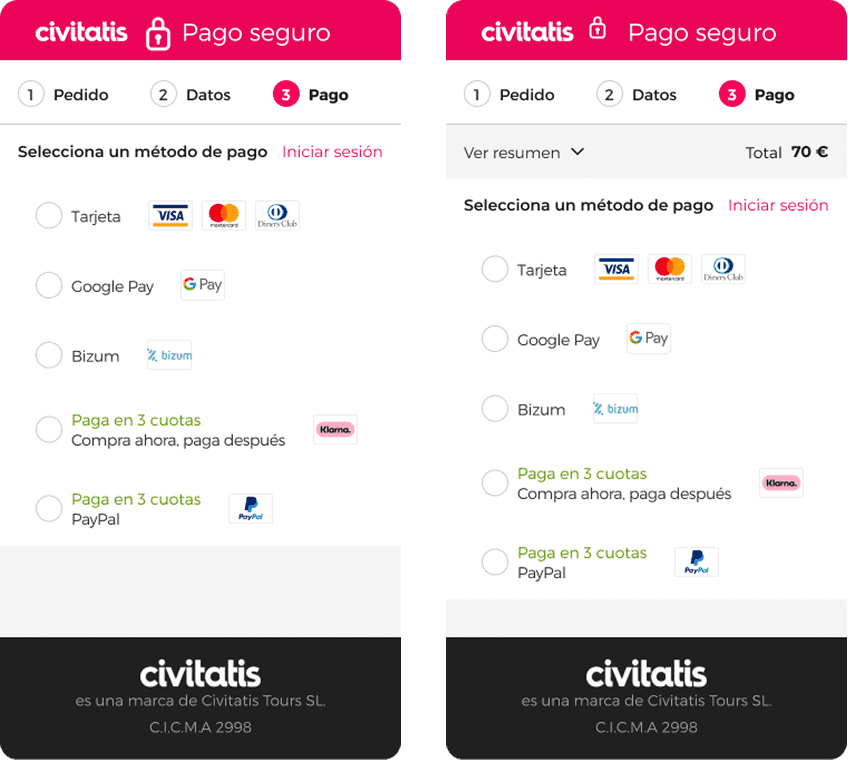
Summary in mobile checkout
Context
After analyzing user behavior through journeys, session recordings, and heatmaps, we identified a clear pattern: once users reached the payment page, many navigated back to review the cart details, creating uncertainty and increasing the likelihood of checkout abandonment.
Hypothesis
Because we knew users were navigating back from the payment page to re-check their cart, we believed that showing the purchase summary on mobile checkout pages would reduce uncertainty, lower abandonment, and lift conversion.
"As a user, seeing what I'm going to pay will reassure me, reduce my uncertainty, and I'll complete the purchase with confidence."
Key learnings
- Uncertainty at checkout is a critical barrier on mobile, users need to see what they're paying for
- Impactful improvements don't always require complex redesigns, a simple summary addition lifted conversion 6%
experiment-cart-exits
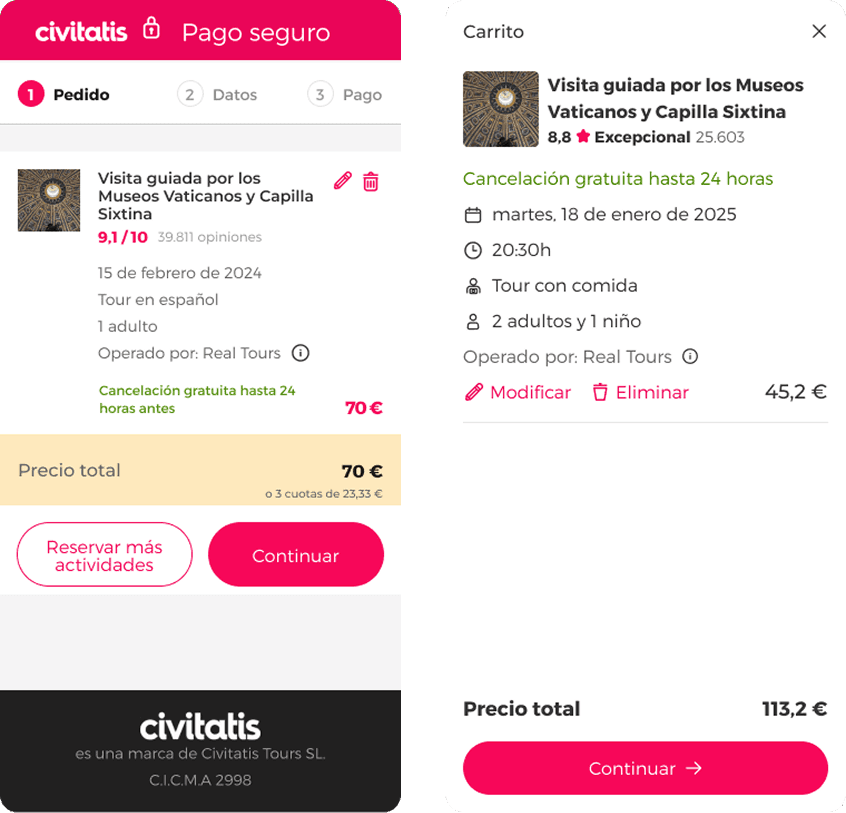
Reduce cart exits
Context
In our efforts to improve the checkout process conversion rate, we noticed that users tended to continue browsing after reaching the shopping cart. 18% of sessions returned to the product detail page, 10% clicked on "Reserve more", and many others clicked on the logo. Almost none of these sessions returned to complete the purchase.
Hypothesis
Because we know that users navigate away from the cart page and do not return to complete their purchase, we believe that by removing the exit links, we will achieve a higher conversion rate from the page to the next step of the checkout process.
"As a user, without distractions, I will complete the process I started."
Key learnings
- Exit paths on the cart page create distraction and leakage at the moment commitment is most fragile
- In high-intent stages, reducing options outperforms adding features, clarity over optionality
experiment-cross-sell
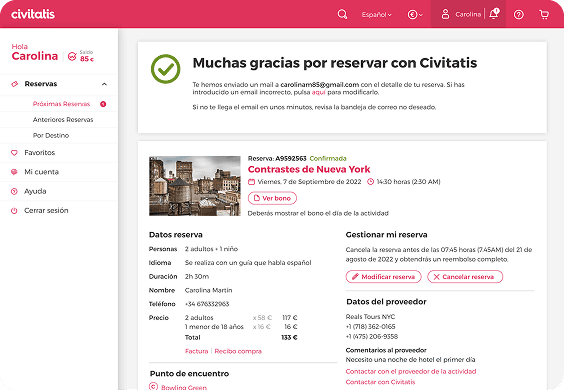
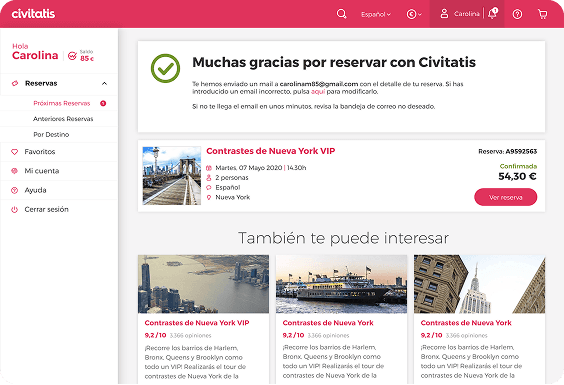
Increase products per trip
Context
One of the company's OKRs was to increase the number of activities per trip per user. On the thank you page, we saw an opportunity to improve this metric, as we were showing all the booking details and cross-selling was at the bottom of the page.
Hypothesis
Because we know that cross-selling is not being displayed above the fold due to the amount of content, we believe that by reducing the content of the purchase confirmation, cross-selling will be visible at first glance and we will be able to increase the number of activities per trip per user.
"As a user, once I have completed my purchase and received the details by email, I will be able to see other options that may be of interest for my trip."
Since the conversion tag was on the thank-you page, we couldn't measure purchase conversion directly.
Key learnings
- Cross-selling visibility is a key driver of engagement, content hierarchy directly impacts behavior
- Post-purchase is a high-value moment for complementary discovery when confirmation details are minimized
more-experiments
Reduce cart exits
Removing exit links on the cart page to eliminate distraction at high-intent moments.
Increase products per trip
Moving cross-sell above the fold on the thank-you page by reducing confirmation content.
how-i-work
How I approach experiments
Each experiment moved through the same seven-phase cycle: discover the opportunity in behavioral data, generate a testable hypothesis, prioritize it against other candidates, design the experiment, implement and monitor the test, analyze the results to reach a decision, and finally document and share what we learned.
how-i-work
Each experiment moved through the same seven-phase cycle: discover the opportunity in behavioral data, generate a testable hypothesis, prioritize it against other candidates, design the experiment, implement and monitor the test, analyze the results to reach a decision, and finally document and share what we learned.
learnings
What I learned
The highest-leverage changes came from reading behavior, not redesigning screens, every winning variant started as a pattern spotted in the data.
Behavioral data (heatmaps, session recordings) consistently revealed problems that metrics alone couldn't explain.
The hardest part was isolating the right variable to test, not the design itself.
Before/after thinking forces clarity: if you can't articulate what's different and why, the experiment isn't ready.
Some of the most useful results were losses, a variant that underperforms forces you to revisit the assumption behind it.
contact